
In business, any expense should have a clear benefit—a concept known as return on investment (ROI). For years, retailers and brands had a hard time understanding the true ROI of in-store demonstrations and other experiential marketing events. Unlike ad circulars, end-cap displays and other traditional promotions, the effects of in-store events on sales weren’t tracked. That all changed when Interactions introduced its proprietary RetailLogic™ system, designed to track, analyze and report on the performance and ROI of Interactions’ events.
“RetailLogic is a groundbreaking tool for Interactions’ customers,” says David Deal, Interactions’ Director of Global Marketing. “It allows us to demonstrate the value of what we do for our customers with a depth that we’ve never been able to do before.”
Deal says the idea for RetailLogic came about in 2010 when he and Giovanni DeMeo, Vice President of Global Marketing & Analytics, were searching for a way to answer customers’ most common question: “Why should we pay for experiential marketing?” DeMeo championed the need for Interactions to develop its own analytics capabilities in order to provide customers with clear ROI results and other insights to help them better understand the long-term impacts of experiential marketing on sales. So, with support from company leadership, Interactions’ own Analytics department and the RetailLogic system were born.
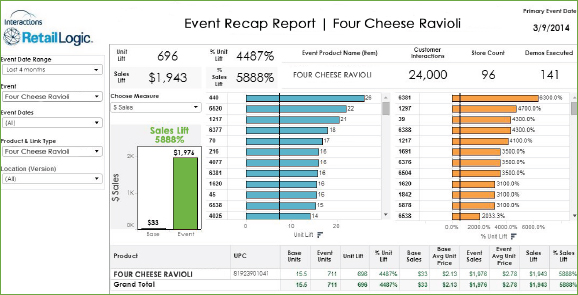
An example of data from an event visualized through RetailLogic.
The RetailLogic system was built entirely in-house. Interactions’ Marketing, Analytics and IT teams worked together to create a system that is user-friendly and visually appealing, and that delivers fast, robust results. The system combines information about Interactions’ events with retailers’ point-of-sale (POS) and loyalty card data to show a wide variety of key metrics. This includes the sales lift of a product on the day of an event and in the weeks following, sales lift of related products (such as other flavors of a product) and lost sales opportunities at stores that didn’t host events.
These results can be visualized in a variety of ways, including geographically, where event or store locations are pinpointed on a map, allowing the user easily see ROI as it relates to location and population. This can help retailers spot possible patterns and gain deeper insights to plan for smarter spends.
“RetailLogic is one of the greatest resources we have for quickly identifying where the value is and translating that for retailers and manufacturers,” says Markus Dmytrzak, Predictive Analytics Specialist for Interactions. “In analytics, speed and time-to-market are very important. Our ability to deliver reports almost in real-time, as well as discover unexpected behaviors and insights, is perceived extremely positively by our clients.”
“RetailLogic sets us apart from the rest of the industry,” adds Deal. “Simply put, there’s really nothing else like it out there.”